Benchmarking Tools
The Cyclone DDS ddsperf tool primarily measures data throughput
and latency of the DDS applications within a network, or within the same board.
The ddsperf tool also helps to do sanity checks that ensure your configuration
is correctly set up and running.
In addition to ddsperf, there are dedicated Examples that show how to measure
the DDS system throughput and the latency with their associated codebase. You can start
from the provided code and customize it to fit your requirements. Both the ddsperf
tool and the examples perform the benchmarking using sequences of octets with different
parameterized sizes.
Important
The throughput and latency examples are not suitable as general DDS
benchmarking tools as they sacrifice performance for simplicity. You cannot compare
test results from these tools with results from other tools.
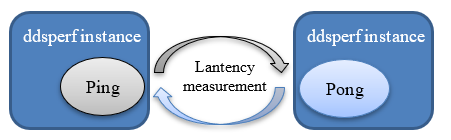
Measuring latency
To measure latency between two different applications, you run
two instances of the ddsperf tool. The first instance has
the role of a sender that sends a given amount of data (a sequence of
octets) at a given rate. The second instance has the role of
receiver that sends back the same amount of data to the sender in a
Ping-Pong scenario. The sending action is triggered by the Ping
option. The receiving behavior is triggered by the Pong action. The
sender measures the roundtrip time and computes the latency as half of
the roundtrip time.
The Ping-Pong scenario avoids clock desynchronization issues that can occur between two machines that do not accurately share the same perception of the time in the network.
To differentiate the two operational modes, the ddsperf tool can
operate either in a Ping mode or in a Pong mode.
To run the Ping-Pong scenario (with default values):
Open two terminals (for example, on Linux-like OSs).
In the first terminal, run the following command:
ddsperf ping
In the second terminal run the following command:
ddsperf pong
To customize the test scenario, you can change the following options:
In Ping mode you can specify:
The Rate and frequency at which data is written. This is specified through the [R[Hz]] option. The default rate is “as fast as possible”. In ping mode, it always sends a new ping as soon as it gets a pong.
The Size of the data that is exchanged. This is specified through the [Size S] option. Using the built-in default topic, 12 bytes (an integer key, an integer sequence number, and an empty sequence of bytes) are sent every time. The size is “as small as possible” by default, depending on the default topic size.
The Listening mode, which can either be
waitsetbased orListenerCallbacks modes. In the waitset mode, theddsperfapplication creates a dedicated thread to wait for the data to return back from the receiving instance ofddsperftool (that is, the instance started with the Pong mode). In the Listener Callback mode, the thread is created by the Eclipse Cyclone DDS middleware. The Listener mode is the default.
In Pong mode,you can only specify one option:
The Listening mode (with two possible values,
waitsetorListener)
For example, to measure local latency between to processes exchanging 2KB at the frequency of 50Hz:
Open two terminals.
In the first terminal, run the following command:
ddsperf ping 50Hz 2048 waitset
In the second terminal run the following command:
ddsperf pong waitset
The output of the ddsperf tool is as shown below:
The output for the Ping application:

The size of the data involved in the test (For example, 12 bytes)
The minimum latency (For example, 78.89 us)
The maximum latency (For example, 544,85 us)
The mean latency (For example, 118.434 us)
As well as the latency at 50%, 90%, or 99% of the time.
The output for the Pong application:

- RSS is the Resident Set Size; it indicates the amount of memory
used by the process (For example, 3.5MB used by the process ID 2680).
VCSW is the number of voluntary switches, it indicates the times when the process waits for input or an event (For example, 2097 times).
IVCSW is the number of involuntary switches, it indicates the times when the process is pre-empted or blocked by a mutex (For example, 6 times).
The percentage of time spent executing user code and the percentage of time spent executing the kernel code in a specific thread (For example, spent almost 0% of the time executing the user code and 5% executing kernel code in thread “ping”).
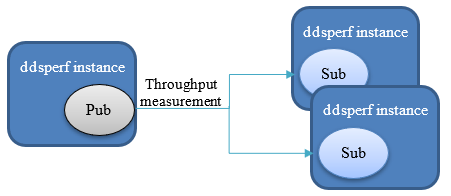
Measuring throughput
To measure throughput between two different applications, run at least two instances of
the ddsperf tool. One terminal acts as a Publisher that sends a set amount of data
(a sequence of octets) at a set rate. The other instances act as Subscriber applications.
Note
When your scenario involves only one subscriber, the UDP unicast mode is used. If several subscriber instances are running, the multicast is automatically used.
Two additional modes are supported:
The Pub mode and the Sub mode.
In the Sub mode, the subscriber operates in one of the following ways:
Listener notifications. Receives a notification each time a new set of data is added to the subscriber’s cache.
WaitSet notifications. Receives a notification whenever the conditions of a WaitSet are met. For further information, refer to WaitSets and Conditions.
Pooling mode. The subscriber cyclically fetches the data from its local cache.
There are two ways to publish each data sample; individually, or by sending them in Burst mode. The following are the parameters for Burst mode:
The Rate and frequency at which data is written (defined by the [R[Hz]] option). The default rate is “as fast as possible”. In pub mode, instead of trying to reach a set rate, it sends data as fast as possible.
The Size of the data that is exchanged (defined by the [Size S] option). The default size is “as small as possible” (depending on the size of the topic).
The Burst Size (only applies to the pub mode) is the number of data samples issued together as a batch (defined by the [Burst N] option). The default size for burst is 1. Note: When going “as fast as possible”, this option does not make any difference.
The default triggering mode is listener for the ping , pong and sub mode.
To run a simple throughput test (with default values):
Open two terminals.
In the first terminal, run the following command:
ddsperf pub size 1k
In the second terminal run the following command:
ddsperf -Qrss:1 sub
This test measures the throughput of data samples with 1Kbytes written as fast as possible.
The -Qrss:1 option in sub mode sets the maximum allowed an increase
in RSS as 1MB. When running the test, if the memory occupied by the
process increases by less than 1MB, the test can successfully run.
Otherwise, an error message is printed out at the end of the test.
As the pub in this example only has a size of 1k, the sub does not
print out an RSS error message at the end of the test.
The output of the ddsperf tool when measuring throughput is as shown
below:
The output for the Pub application:

RSS is the Resident Set Size; it indicates the amount of memory used by the process (For example, 6.3MB used by the process ID “4026”);
VCSW is the number of voluntary switches, it indicates the times when the process waits for input or an event (For example, 1054 times);
IVCSW is the number of involuntary switches, it indicates the times when the process is pre-empted or blocked by a mutex (For example, 24 times);
The percentage of time spent executing user code and the percentage of time spent executing kernel code in a specific thread (For example, spent 34% of the time executing the user code and 11% executing kernel code in thread “pub”).
The output for the Sub application:

The size of the data involved in this test (For example, 1024 bytes, which is the “size 1k” defined in the pub command).
The total packets received (For example, 614598).
The total packets lost (For example, 0).
The packets received in a 1 second reporting period (For example, 212648).
The packets lost in a 1 second report period (For example, 0).
The number of samples processed by the Sub application in 1s (For example, 21260 KS/s, with the unit KS/s is 1000 samples per second).
Measuring Throughput and Latency in a mixed scenario
In some scenarios, it can be useful to measure the throughput and latency at the same time.
The ddsperf tool allows you to mix these two scenarios.
The Ping mode can be combined with the Pub mode to address such cases.
The [Ping x%] switch combined with the Pub mode allows you to send a fraction of samples x% as if they were used in the Ping mode.
The different modes of the ddsperf tool are summarized in the figure
below.
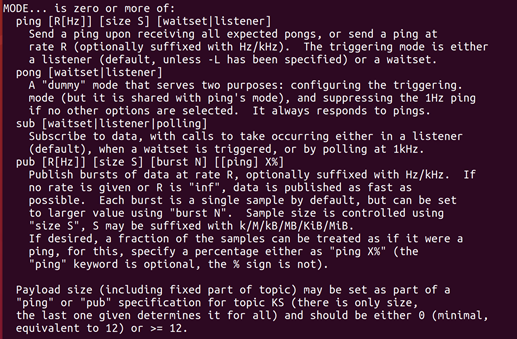
To get more information for the ddsperf tool, use the [help] option:
ddsperf help
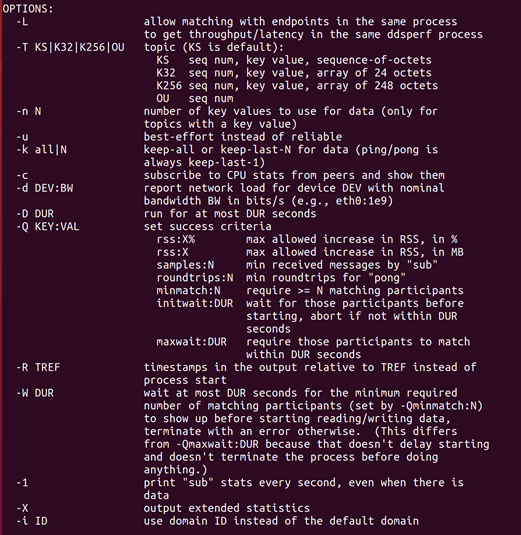
Additional options
As well as selecting the mode, you can also select the options
to specify how to send and receive the data (such as modifying the
reliable QoS from Reliable to Best-Effort with the -u option), or
how to evaluate or view the data in the ddsperftool.
The options you can select are listed in the ddsperf help
menu, as shown below.